Automate data-driven actions | Data Activator in Microsoft Fabric
React fast to changes in data with an automated system of detection and action using Data Activator. Monitor and track changes at a granular level as they happen, instead of at an aggregate level where important insights may be left in the detail and have already become a problem.

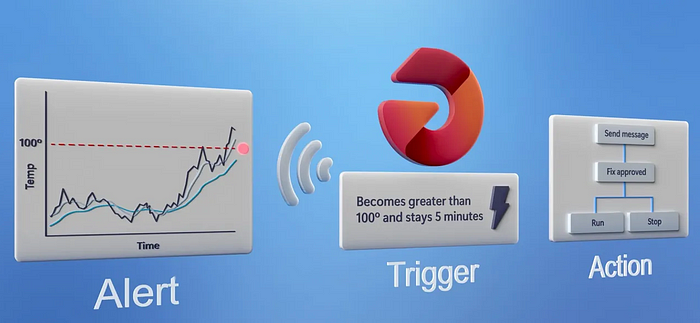
As a domain expert, this provides a no code way to take data, whether real-time streaming from your IoT devices, or batch data collected from your business systems, and dynamically monitor patterns by establishing conditions. When these conditions are met, Data Activator automatically triggers specific actions, such as notifying dedicated teams or initiating system-level remediations.
Join Will Thompson, Group Product Manager for Data Activator, as he shares how to monitor granular high volume of operational data and translate it into specific actions.
Monitor and react to changes in your real-time.

How to use Data Activator in Microsoft Fabric.
Automate monitoring of batch data and trigger alerts.

See how Data Activator in Microsoft Fabric works with Power BI.
Trigger automated workflows.

Streamline processes, and respond to data changes in real-time. Stay ahead of potential issues using Data Activator with Power Automate.
Watch our video here.
QUICK LINKS:
00:00 — Monitor and track operational data in real-time
00:53 — Demo: Logistics company use case
02:49 — Add a condition
04:04 — Test actions
04:36 — Batch data
06:21 — Trigger an automated workflow
07:12 — How it works
08:12 — Wrap up
Link References
Get started at https://aka.ms/dataActivatorPreview
Check out the Data Activator announcement blog at https://aka.ms/dataActivatorBlog
Unfamiliar with Microsoft Mechanics?
As Microsoft’s official video series for IT, you can watch and share valuable content and demos of current and upcoming tech from the people who build it at Microsoft.
- Subscribe to our YouTube: https://www.youtube.com/c/MicrosoftMechanicsSeries
- Talk with other IT Pros, join us on the Microsoft Tech Community: https://techcommunity.microsoft.com/t5/microsoft-mechanics-blog/bg-p/MicrosoftMechanicsBlog
- Watch or listen from anywhere, subscribe to our podcast: https://microsoftmechanics.libsyn.com/podcast
Keep getting this insider knowledge, join us on social:
- Follow us on Twitter: https://twitter.com/MSFTMechanics
- Share knowledge on LinkedIn: https://www.linkedin.com/company/microsoft-mechanics/
- Enjoy us on Instagram: https://www.instagram.com/msftmechanics/
- Loosen up with us on TikTok: https://www.tiktok.com/@msftmechanics
Video Transcript:
-We need data to make decisions. Yet being able to react fast to changes in your data is the difference between addressing an issue as it’s unfolding versus when it’s already become a problem. This means being able to monitor and track important operational data changing at a granular level as it happens versus just at an aggregate level, where important insights may be left in the detail and you may only be reacting after the fact.
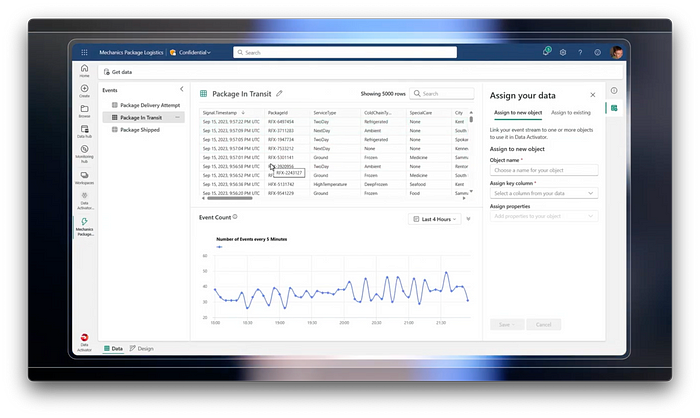
-Today I’ll show you how you can create your own automated system of detection and action with Data Activator. It gives you, as a domain expert, a no-code way to take data, whether that’s real-time streaming data from your IoT devices, or batch data collected from your business systems, and dynamically monitor patterns by establishing rich conditions which, when matched, can automatically trigger specific actions such as notifying a team or performing system level remediations. To show you how Data Activator can monitor granular high volume of operational data and translate it into specific actions, I’ll use the example of a logistics company that manages the delivery of sensitive items like medicines or perishable goods. Here we are in the Data Activator’s trigger designer where you configure what you want to monitor and the actions to take. We can see three event streams from our IoT sensors, but it could just as easily be data from Power BI, a data warehouse, or from OneLake in Microsoft Fabric. I can see the raw events. They’re flowing in real-time and we see them arriving automatically. They’re showing up here highlighted in green as they arrive.
-In this case, I want to set up an alert when packages are getting too hot. I need to tell Data Activator what a package is, which column uniquely identifies each package, and what values in the events that I care about, in my case weight, temperature, special care, humidity, and city. Now I’ll save this and move over to the object that’s been created. I’ve just jumped forward here to a package object I’ve already created where I’ve also brought in a second event stream. I wanted to show that I’ve combined data from two different places. In addition to our package sensor data, I’ve also pulled in data for the shipper and recipient of each package. I’m going to start a new trigger and select the temperature property to start. I can see the raw temperature readings from the packages in the system, and we’ve taken a sample of five of these.
-You can see there are hundreds, though, being tracked and we could scale up to hundreds of thousands in really large scale, realistic systems if needed. This data is coming through in real-time and I can see it updating in the chart. I can start by smoothing this data out and taking an average, maybe using 10 minute intervals, just to reduce any anomalies or spikes in the data. And then I specify what I want to detect in the data. We support a few options like when the value becomes greater than or less than a numeric threshold, when it enters or exits a range, or under common, just whenever it changes from one value to another. Let’s add a condition where the data becomes greater than a value, in this case 20. But importantly, instead of just triggering each time that condition is met on the event, I can also choose to trigger only when it happens a certain number of times, or when the value crosses 20 and stays there for a length of time.
-I’ll leave at each time for now, but this can help reduce the noise in the system and really focus on issues that are worthy of attention. At the bottom I can see how many times this threshold would have been crossed in the last 24 hours over all the packages in the system, not just our sample of five. From here, the last thing to do is to choose the action to take when that threshold condition is met. I could send an e-mail notification, alternatively a Teams message, and I can also reach out into operational systems using a custom action to call Power Automate. Right now I’ll send a Teams message. It populates with my information, and I can enter a headline. So I’ll paste one in. And you’ll notice I’ve used curly braces here to specify properties or values from the event, like the recipient of the package. I can even route the messages to someone dynamically based on values in the events, like the shipper email.
-Then I can specify any other information to include in the message to help give context about what’s caused the trigger to fire. Now I’m going to test this action. If I open my Teams window, I can see the notification and exactly when the trigger fired, which package it was and what the temperature was, and all of that extra context I just selected. This test looks really good, so I can go back over to Data Activator and confirm my logic and actions by hitting start. Now it will be running in the background, monitoring for those conditions, and taking actions accordingly. That’s how you can use Data Activator on streaming data to send an alert on individual business objects like one specific package that’s overheating.
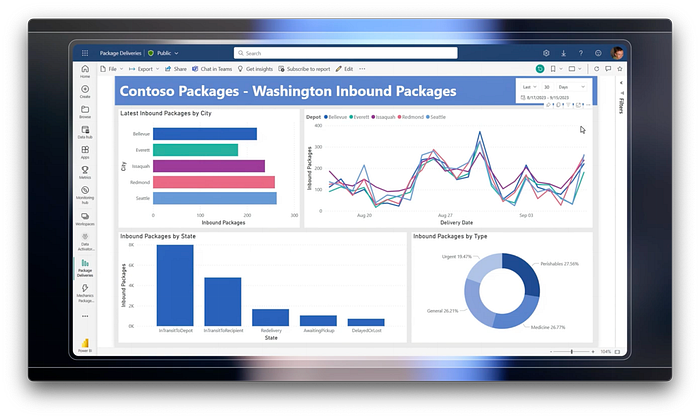
-For batch data, Data Activator also works with Power BI, something most of you may be familiar with. If you’ve got reports that you’re monitoring on a regular basis, Data Activator can save you time by tracking that data on your behalf. In this case, we’re monitoring packages inbound to our delivery depots and want to set up an alert if there are too many packages arriving in any one of these depots. All that I need to do is select the corresponding visual, in this case the line chart which show the number of inbound packages by depot over the last 30 days. So this is being updated less frequently, just once a day here. And I can then choose trigger action.
-Here, I can create an alert. I can specify the measure I want to track, in this case inbound packages, and in for each I’ll choose what I want to track it for, in this case depot. This shows the filters and slices that are being applied to the chart will also be applied to the trigger. and I can use this every option to determine the schedule on which to check the data. In this case, I want to track it every day. Then I’ll add the threshold I want to watch for. In this case, I’ll set this to 200 so that I can get alerted if there are more than 200 packages due to arrive in any city. Finally, I’ll choose where to save this. And I’m going to put it back in the same reflex item we used before. We call the items reflexes because they’re acting as part of a digital nervous system responding to changes and taking actions accordingly. When you select continue, this creates the trigger, hooks it up to the Power BI dataset to query it on a schedule for me. And now if I look in my object model, I can see that I’ve got a city object. This was created from the packages inbound to the city visual. And it’s monitoring each of the packages inbound. It’s counting the number of packages on the way and looking for times when it goes over 200, and then sending an email with everything I configured according to those conditions.
-Now this time, instead of sending an email or Teams message, I want to trigger an automated workflow in Power Automate. I’ve already created a Custom Action that hooks Data Activator up to this Power Automate flow, so I’ll select that. And if I jump into Flow itself, you can see it’s listening for that Data Activator trigger, it gets some details from Dynamics 365 about the manager, sends them a staffing report and then starts and approval workflow which will be used to authorize bringing on more temporary workers. Back in Data Activator, here we’re looking over the last month. The dots in the chart represent each time the condition was met for each city, triggering a separate approval workflow in Power Automate. So in just a few minutes we’ve built a system of detection that can automate actions to save you from constantly monitoring your Power BI reports, getting you ahead of operational issues before they become a problem.
-So what is it that makes this possible? Well, Data Activator is part of Microsoft Fabric, our next-generation data analytics service that’s powered by our multi-cloud data lake called OneLake. This uses the universal parquet file format and shortcuts to bring in data wherever it resides without you needing to move it. Data Activator can then listen for changes in that data based on the conditions you’ve established, and trigger these automated notifications in applications like Teams or email or those system-level workflows with conditions that you define. And of course, it will integrate seamlessly with all of the data management and governance processes in Microsoft Fabric. And while we looked at how Data Activator can be used for logistics today, you can use Data Activator in any number of scenarios. For example, if you’re in retail, you could monitor store inventory levels to create an alert if you’ve got over $50,000 of inventory on hand. Or for fleet management, as you’re seeing here with a self-service bicycle rental example. You could set triggers to tell field operators when there aren’t enough bikes available in a particular street or a city.
-So, to get started with Data Activator, follow the steps at aka.ms/DataActivatorPreview. Of course, keep watching Microsoft Mechanics for the latest tech updates, and thanks for watching.
